English Version of This Blog Post:
https://fizzez.github.io/2020/09/23/nb-magic-js-en/
描述 之前一直在Jupyter Notebook里用Plotly作图,最近写JS开始接触了Plotly.js,发现Plotly的Python API和JS API在命名上有很多相同的地方(毕竟Plotly最后呈现的图表就是JS写的嘛)。于是就想着如果在Jupyter Notebook中能直接调用Plotly.js的API作图的话,灵活性似乎会大一点。。。ok 那就折腾一下。
方法 参考了HylaruCoder写的参考[1]教程,决定使用RequireJS来动态引入并执行Plotly.js。
首先,在Jupyter Notebook中执行JS的Magic command是%%javascript或者%%js。
然后问题就是怎样把Plotly.js引入,搞一个HTML div元素,并且把做好的图写进去了。
引入Plotls.js使用了这样的代码,把plotly的cdn地址扔进去:
1
2
3
4
5
6
%%js requirejs.config({ paths: { plotly: 'https://cdn.plot.ly/plotly-1.55.2.min.js?noext' , } });
plotly的cdn地址可以在官网 查到。
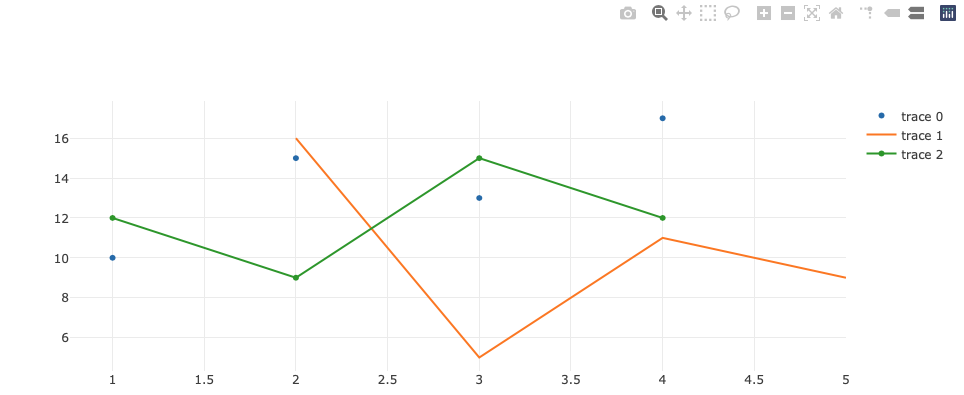
然后通过element.append()添加一个<div>元素,使用引入的Plotly.js包做一个示例图:
1
2
3
4
5
6
7
8
9
10
11
12
13
14
15
16
17
18
19
20
21
22
23
24
25
26
27
28
29
30
%%js element.append('<div id="plotly_graph" margin: 0 auto"></div>' ); (function (element ) requirejs(['plotly' ], function (Plotly ) var trace1 = { x: [1 , 2 , 3 , 4 ], y: [10 , 15 , 13 , 17 ], mode: 'markers' , type: 'scatter' }; var trace2 = { x: [2 , 3 , 4 , 5 ], y: [16 , 5 , 11 , 9 ], mode: 'lines' , type: 'scatter' }; var trace3 = { x: [1 , 2 , 3 , 4 ], y: [12 , 9 , 15 , 12 ], mode: 'lines+markers' , type: 'scatter' }; var data = [trace1, trace2, trace3]; Plotly.newPlot(document .getElementById('plotly_graph' ), data); }); })(element);
按照HylaruCoder的方法,我把引入Plotls.js和使用Plotls.js分成了两个不同的Notebook Cell执行,但是一直显示空白div。通过查看JS console发现RequireJS一直在报这样的错误Failed to load resource: the server responded with a status of 404 (Not Found)。(满脸问号),幸好参考[2]建议我们把引入(require.config)和使用(require(['mymodule'], function( mymodule ))放在同一个Notebook Cell中使用,然后就成功了。图长这样:
上面的例子里,图表的数据固定的写在了JS中,接下来需要思考的就是怎么把Python的结果数据传给JS了。-> 使用JSON。先上代码:
1
2
3
4
5
6
7
8
9
10
11
12
13
14
15
16
17
18
19
20
21
22
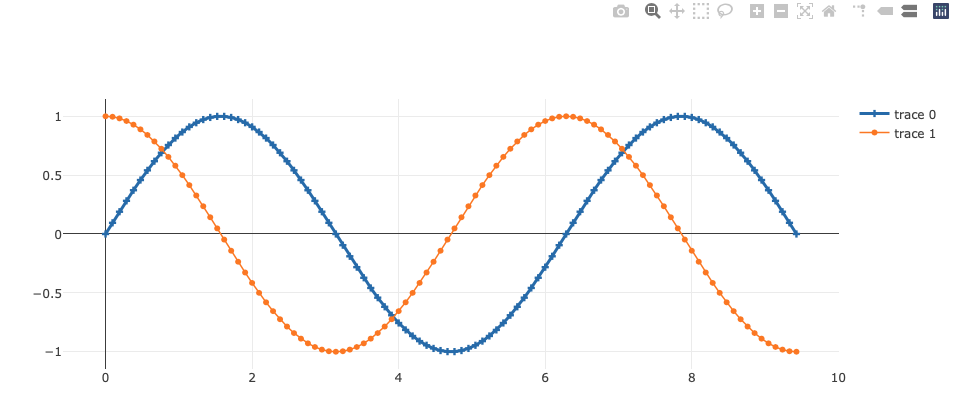
import jsonimport numpy as npfrom IPython.core.display import Javascripteval_x = np.linspace(0 , 3 * np.pi, 100 ) trace_1 = {'x' : eval_x.tolist(), 'y' : np.sin(eval_x).tolist(), 'mode' : 'lines+markers' , 'type' : 'scatter' , 'line' : {'width' : 3 }, 'marker' : {'symbol' : 'cross' }} trace_2 = {'x' : eval_x.tolist(), 'y' : np.cos(eval_x).tolist(), 'mode' : 'lines+markers' , 'type' : 'scatter' , 'line' : {'width' : 1.5 }, 'marker' : {'symbol' : 'circle' }} plotly_json = {'data' : [trace_1, trace_2]} Javascript(f"window.plotly_json = JSON.parse('{json.dumps(plotly_json, ensure_ascii=False )} ')" )
Ok首先生成了两个dict格式的trace(这结构和Plotly.py没什么两样。。),通过json.dumps把dict搞成JSON后传给了window.plotly_json。(Notice: ndarray对象必须转成list才能被序列化为JSON)
然后从window.plotly_json把数据读出来做图就好了,代码和之前类似:
1
2
3
4
5
6
7
%%js element.append('<div id="plotly_graph_json" margin: 0 auto"></div>' ); (function (element ) requirejs(['plotly' ], function (Plotly ) Plotly.newPlot(document .getElementById('plotly_graph_json' ), plotly_json.data); }); })(element);
结果长这样:
以后就可以快快乐乐的在Jupyter Notebook里用Plotly.js了!(如果真的有需要的话= =)
完整代码和结果在这个Jupyter Notebook里:
https://github.com/Fizzez/playground/blob/master/python/notebook-magic-html-js.ipynb
** 由于自己对JS的了解还不充分,还有不少地方不能完全理解。姑且先分享一下使用方法,等日后再来更新细节。
参考
如何优雅地在 IPython Notebook 中使用 ECharts - HylaruCoder
Require.js bug random Failed to load resource - Stack Overflow

