本文中文版:
Description
Plotly is one of the best tools I experienced to visualize data in Jupyter Notebook. While I am making a simple APP with JavaScript and Plotly.js, I found the API names of Plotly.py and Plotly.js are quite similar to each other. This new find inspired me to use Plotly.js in Jupyter Notebook, in which way I think is more flexible (maybe).
Method
Before start implementing anything, I searched for existing solutions. The method by HylaruCoder is one of the best (see Ref.[1]). According to HylaryCoder, RequireJS is a JS tool supported originally by Jupyter Notebook to dynamically load a JS module, which enable us to load plotls.js from the CDN address provided officially by Plotly.
Okay the code to load Plotly.js is like the following. By the way, the magic command to tell Jupyter Notebook to execute a JS script is %%javascript or %%js:
1 | %%js |
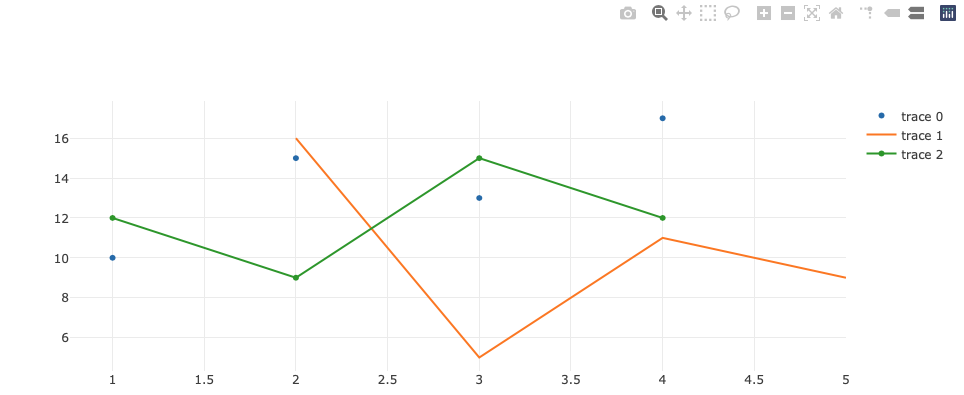
Then we’ll need a <div> element in the HTML page for sure, to contain the plot. The element is appended with command element.append(). Given the example data and call Plotly.js API like the following code, we could have the example figure plotted.
1 | %%js |
Wait, an error was thrown when I tried to execute the 2 code cells separately. The error message was from RequireJS, saying Failed to load resource: the server responded with a status of 404 (Not Found). Thanks to the answer from Ref.[2], the error disappeared after I merged the 2 code cells and execute. The plotted figure shoule like this:
In the example above, the example data for plotting is given in JS scripts. Then we’ll need to consider how to pass the processed data from Python cells to JS cells.
The answer is to use JSON (via the HTML page). Here’s the Python script to pass the generated data to HTML page ( window.plotly_json):
1 | import json |
So in this script, 2 plot traces in dict type are generated (naming of variables here are very like those in Plotly.js). Then serialize the dictionary to JSON format and pass to window.plotly_json. (Notice: ndarray object is not be able to be serialized to JSON, use tolist() to conver to list in advance.)
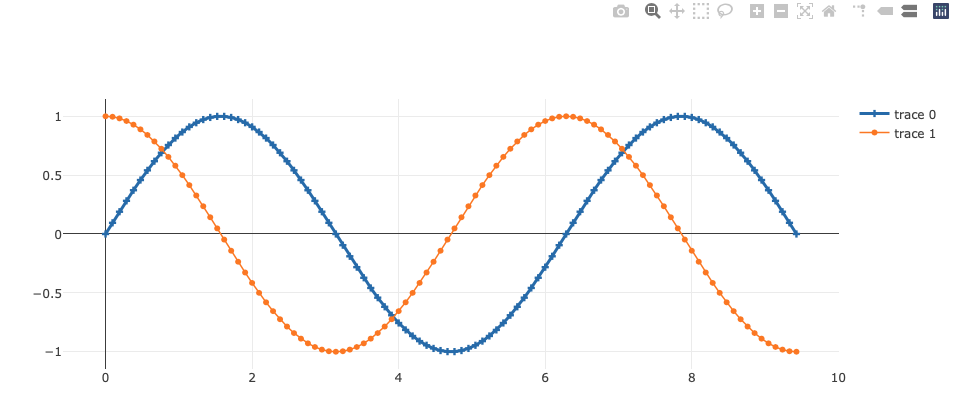
Then the following script shows how to read the JSON data from HTML page and visualize with Plotly.js in the way introduced at the beginning.
1 | %%js |
The result will be like this:
All the scripts and results are given together in this Jupyter Notebook:
https://github.com/Fizzez/playground/blob/master/python/notebook-magic-html-js.ipynb