0%

Description

I was wondering how PyTorch deals with those mathematically non-differentiable loss function for these days. So I have a brief summary here to share my findings.

TL;DR:

Basically, all the operations provided by PyTorch are ‘differentiable’. As for mathematically non-differentiable operations such as relu, argmax, mask_select and tensor slice, the elements at which gradients are not able to be calculated are set to gradient 0.

Investigation

Mathematically non-differentiable situation

For mathematically non-differentiable operations such as relu, argmax, mask_select and tensor slice, the elements at which gradients are not able to be calculated are set to gradient 0.

Take absolute function for example:

Absolute function is not differentiable at $x=0$, mathematically, but PyTorch set the gradient at this point to be 0. Here is a test:

1
2
3
4
5
6
import torch
for i in range(11):
x = torch.tensor([i-5], dtype=float, requires_grad=True)
y = torch.abs(x)
y.backward()
print(x.grad)

The output will be:

1
2
3
4
5
6
7
8
9
10
11
tensor([-1.], dtype=torch.float64)
tensor([0.], dtype=torch.float64)
tensor([1.], dtype=torch.float64)

Like what Mertens said in this answer,

This function isn’t analytically differentiable. However, at every point except 0, it is. In practice, for the purpose of gradient descent, it works well enough to treat the function as if it were differentiable. You’ll rarely be computing the gradient at precisely 0, and even if you do, it’s sufficient to handle things via a special case.

As for how to handle the special case, here is a good official example. The case could be specially treated in your backward function.

What is the “Keng”

Well. “Keng” is actually the Pinyin of the Chinese character “坑”, meaning somgthing may mess you up. Here the “Keng” stands for the pitfall better to be aware of when using PyTorch in several specific situations.

I feel like to write something about ML in this blog, but do not actually have any topic at hand. “Keng” series will be a good start to summarize my experience in ML. Hope these experiences could help you :-).

Keng - 1

Problem

Generally, while using torch.nn.parallel.DistributedDataParallel , the code runs on multiple GPUs independently, meaning one process per GPU. The memory usage of each GPU should be close.

But I once found that a part of memory of gpu 0 was occupied by processes running on gpu 1-3 and caused CUDA out of memory error.

Cause

When loading a pretrained model with torch.load(), it put data to gpu 0.

Solution

An easy solution is to remap the data to cpu with torch.load('checkpoint.pth', map_location=torch.device('cpu'))

本文中文版:

https://fizzez.github.io/2020/09/20/nb-magic-js/

Description

Plotly is one of the best tools I experienced to visualize data in Jupyter Notebook. While I am making a simple APP with JavaScript and Plotly.js, I found the API names of Plotly.py and Plotly.js are quite similar to each other. This new find inspired me to use Plotly.js in Jupyter Notebook, in which way I think is more flexible (maybe).

Method

Before start implementing anything, I searched for existing solutions. The method by HylaruCoder is one of the best (see Ref.[1]). According to HylaryCoder, RequireJS is a JS tool supported originally by Jupyter Notebook to dynamically load a JS module, which enable us to load plotls.js from the CDN address provided officially by Plotly.

Okay the code to load Plotly.js is like the following. By the way, the magic command to tell Jupyter Notebook to execute a JS script is %%javascript or %%js:

1
2
3
4
5
6
%%js
requirejs.config({
paths: {
plotly: 'https://cdn.plot.ly/plotly-1.55.2.min.js?noext',
}
});

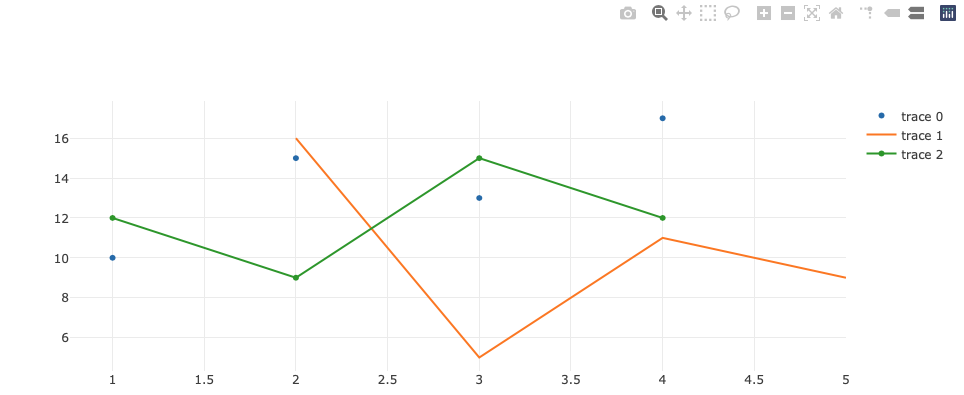
Then we’ll need a <div> element in the HTML page for sure, to contain the plot. The element is appended with command element.append(). Given the example data and call Plotly.js API like the following code, we could have the example figure plotted.

1
2
3
4
5
6
7
8
9
10
11
12
13
14
15
16
17
18
19
20
21
22
23
24
25
26
27
28
29
30
%%js
element.append('<div id="plotly_graph" margin: 0 auto"></div>');
(function(element) {
requirejs(['plotly'], function(Plotly) {
var trace1 = {
x: [1, 2, 3, 4],
y: [10, 15, 13, 17],
mode: 'markers',
type: 'scatter'
};

var trace2 = {
x: [2, 3, 4, 5],
y: [16, 5, 11, 9],
mode: 'lines',
type: 'scatter'
};

var trace3 = {
x: [1, 2, 3, 4],
y: [12, 9, 15, 12],
mode: 'lines+markers',
type: 'scatter'
};

var data = [trace1, trace2, trace3];

Plotly.newPlot(document.getElementById('plotly_graph'), data);
});
})(element);

Wait, an error was thrown when I tried to execute the 2 code cells separately. The error message was from RequireJS, saying Failed to load resource: the server responded with a status of 404 (Not Found). Thanks to the answer from Ref.[2], the error disappeared after I merged the 2 code cells and execute. The plotted figure shoule like this:

Plotly.js in Jupyter Notebook

In the example above, the example data for plotting is given in JS scripts. Then we’ll need to consider how to pass the processed data from Python cells to JS cells.

The answer is to use JSON (via the HTML page). Here’s the Python script to pass the generated data to HTML page ( window.plotly_json):

1
2
3
4
5
6
7
8
9
10
11
12
13
14
15
16
17
18
19
20
21
22
import json
import numpy as np
from IPython.core.display import Javascript

eval_x = np.linspace(0, 3 * np.pi, 100)

trace_1 = {'x': eval_x.tolist(),
'y': np.sin(eval_x).tolist(),
'mode': 'lines+markers',
'type': 'scatter',
'line': {'width': 3},
'marker': {'symbol': 'cross'}}
trace_2 = {'x': eval_x.tolist(),
'y': np.cos(eval_x).tolist(),
'mode': 'lines+markers',
'type': 'scatter',
'line': {'width': 1.5},
'marker': {'symbol': 'circle'}}

plotly_json = {'data': [trace_1, trace_2]}

Javascript(f"window.plotly_json = JSON.parse('{json.dumps(plotly_json, ensure_ascii=False)}')")

So in this script, 2 plot traces in dict type are generated (naming of variables here are very like those in Plotly.js). Then serialize the dictionary to JSON format and pass to window.plotly_json. (Notice: ndarray object is not be able to be serialized to JSON, use tolist() to conver to list in advance.)

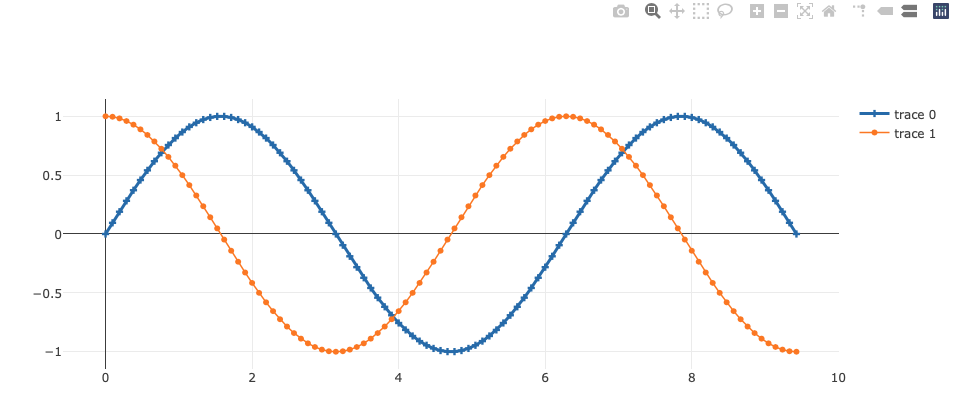
Then the following script shows how to read the JSON data from HTML page and visualize with Plotly.js in the way introduced at the beginning.

1
2
3
4
5
6
7
%%js
element.append('<div id="plotly_graph_json" margin: 0 auto"></div>');
(function(element) {
requirejs(['plotly'], function(Plotly) {
Plotly.newPlot(document.getElementById('plotly_graph_json'), plotly_json.data);
});
})(element);

The result will be like this:

Plotly.js in Jupyter Notebook

All the scripts and results are given together in this Jupyter Notebook:

https://github.com/Fizzez/playground/blob/master/python/notebook-magic-html-js.ipynb

Ref

  1. 如何优雅地在 IPython Notebook 中使用 ECharts - HylaruCoder
  2. Require.js bug random Failed to load resource - Stack Overflow

English Version of This Blog Post:

https://fizzez.github.io/2020/09/23/nb-magic-js-en/

描述

之前一直在Jupyter Notebook里用Plotly作图,最近写JS开始接触了Plotly.js,发现Plotly的Python API和JS API在命名上有很多相同的地方(毕竟Plotly最后呈现的图表就是JS写的嘛)。于是就想着如果在Jupyter Notebook中能直接调用Plotly.js的API作图的话,灵活性似乎会大一点。。。ok 那就折腾一下。

方法

参考了HylaruCoder写的参考[1]教程,决定使用RequireJS来动态引入并执行Plotly.js。

首先,在Jupyter Notebook中执行JS的Magic command是%%javascript或者%%js

然后问题就是怎样把Plotly.js引入,搞一个HTML div元素,并且把做好的图写进去了。

引入Plotls.js使用了这样的代码,把plotly的cdn地址扔进去:

1
2
3
4
5
6
%%js
requirejs.config({
paths: {
plotly: 'https://cdn.plot.ly/plotly-1.55.2.min.js?noext',
}
});

plotly的cdn地址可以在官网查到。

然后通过element.append()添加一个<div>元素,使用引入的Plotly.js包做一个示例图:

1
2
3
4
5
6
7
8
9
10
11
12
13
14
15
16
17
18
19
20
21
22
23
24
25
26
27
28
29
30
%%js
element.append('<div id="plotly_graph" margin: 0 auto"></div>');
(function(element) {
requirejs(['plotly'], function(Plotly) {
var trace1 = {
x: [1, 2, 3, 4],
y: [10, 15, 13, 17],
mode: 'markers',
type: 'scatter'
};

var trace2 = {
x: [2, 3, 4, 5],
y: [16, 5, 11, 9],
mode: 'lines',
type: 'scatter'
};

var trace3 = {
x: [1, 2, 3, 4],
y: [12, 9, 15, 12],
mode: 'lines+markers',
type: 'scatter'
};

var data = [trace1, trace2, trace3];

Plotly.newPlot(document.getElementById('plotly_graph'), data);
});
})(element);

按照HylaruCoder的方法,我把引入Plotls.js和使用Plotls.js分成了两个不同的Notebook Cell执行,但是一直显示空白div。通过查看JS console发现RequireJS一直在报这样的错误Failed to load resource: the server responded with a status of 404 (Not Found)。(满脸问号),幸好参考[2]建议我们把引入(require.config)和使用(require(['mymodule'], function( mymodule ))放在同一个Notebook Cell中使用,然后就成功了。图长这样:

Plotly.js in Jupyter Notebook

上面的例子里,图表的数据固定的写在了JS中,接下来需要思考的就是怎么把Python的结果数据传给JS了。-> 使用JSON。先上代码:

1
2
3
4
5
6
7
8
9
10
11
12
13
14
15
16
17
18
19
20
21
22
import json
import numpy as np
from IPython.core.display import Javascript

eval_x = np.linspace(0, 3 * np.pi, 100)

trace_1 = {'x': eval_x.tolist(),
'y': np.sin(eval_x).tolist(),
'mode': 'lines+markers',
'type': 'scatter',
'line': {'width': 3},
'marker': {'symbol': 'cross'}}
trace_2 = {'x': eval_x.tolist(),
'y': np.cos(eval_x).tolist(),
'mode': 'lines+markers',
'type': 'scatter',
'line': {'width': 1.5},
'marker': {'symbol': 'circle'}}

plotly_json = {'data': [trace_1, trace_2]}

Javascript(f"window.plotly_json = JSON.parse('{json.dumps(plotly_json, ensure_ascii=False)}')")

Ok首先生成了两个dict格式的trace(这结构和Plotly.py没什么两样。。),通过json.dumpsdict搞成JSON后传给了window.plotly_json。(Notice: ndarray对象必须转成list才能被序列化为JSON)

然后从window.plotly_json把数据读出来做图就好了,代码和之前类似:

1
2
3
4
5
6
7
%%js
element.append('<div id="plotly_graph_json" margin: 0 auto"></div>');
(function(element) {
requirejs(['plotly'], function(Plotly) {
Plotly.newPlot(document.getElementById('plotly_graph_json'), plotly_json.data);
});
})(element);

结果长这样:

Plotly.js in Jupyter Notebook

以后就可以快快乐乐的在Jupyter Notebook里用Plotly.js了!(如果真的有需要的话= =)

完整代码和结果在这个Jupyter Notebook里:

https://github.com/Fizzez/playground/blob/master/python/notebook-magic-html-js.ipynb

** 由于自己对JS的了解还不充分,还有不少地方不能完全理解。姑且先分享一下使用方法,等日后再来更新细节。

参考

  1. 如何优雅地在 IPython Notebook 中使用 ECharts - HylaruCoder

  2. Require.js bug random Failed to load resource - Stack Overflow

SSH原理

Secure Shell (SSH),是一种加密的网络传输协议,最常见的用途是登录到远程电脑中执行命令。SSH使用客户端-服务器模型,标准端口为22。SSH以非对称加密实现身份验证(关于对称以及非对称加密, 详见参考[2])。从客户端来看,SSH提供两种级别的安全验证:

  1. 基于密码的安全验证:使用自动生成的“公钥-私钥对”来简单的加密网络链接,随后使用密码认证进行登录。所有传输的数据都会被加密,但是可能会有别的服务器在冒充真正的服务器,无法避免被中间人攻击。
  2. 基于密钥的安全验证:创建”公钥-私钥对“(e.g. 使用ssh-keygen命令),通过生成的密钥进行认证。公钥放在需要访问的服务器上(通常在~/.ssh/authorized_keys文件中),而对应的私钥由客户端保管。客户端软件会向服务器发出请求,请求用你的密钥进行安全验证。服务器收到请求后,先在你在该服务器的用户根目录下寻找你的公钥,然后把它和你发过来的公钥进行比较。如果两者一致,服务器就用公钥加密“质询”(challenge)并把它发给客户端软件,从而避免被中间人攻击。

基于密码的安全验证流程

基于密码的安全验证流程

  1. Server收到Client的登录请求,并把自己的公钥发送给Client。
  2. Client使用这个公钥将登陆密码进行加密。
  3. Client将加密后的密码发送给Server。
  4. Server使用自己的私钥将消息解密得到登陆密码,并验证其合法性。
  5. 根据验证结果,给Client相应的响应。

基于密钥的安全验证流程

  1. Client侧生成一对公钥和私钥,并将自己的公钥存放在Server端,追加在文件authorized_keys中。
  2. Server收到客户端的连接请求后,在authorized_keys中匹配到Client事先保存的的公钥pubKey,并生成随机数R,用Client的公钥对该随机数进行加密得到PubKey(R),然后将加密后的信息发送给Client。
  3. Client通过私钥对消息解密得到随机数R,然后对随机数和本次会话的SessionKey利用MD5生成摘要Digest1,发送给Server。
  4. Server也会对同样的RSessionKey利用同样的摘要算法生成Digest2
  5. Server端比较Digest1Digest2是否相同,给Client相应响应。

SSH实践:Github多用户设置(macOS)

生成密钥

ssh-keygen命令用于为ssh生成,管理和转换认证密钥。该命令有几个常用选项,-t用于指定加密方式,可选dsa | ecdsa | ed25519 | rsa, 一般为rsa-C用于指定注释,通常使用自己的邮件名作为注释;-b用于制定密钥长度,对于RSA加密方式,最低长度为1024(可被破解),默认长度为2048,建议为2048或4096。示例如下:

1
2
3
4
5
6
7
8
9
10
11
12
13
14
15
16
17
18
19
20
21
$ ssh-keygen -t rsa -C "your_email@example.com" -b 2048
Generating public/private rsa key pair.
Enter file in which to save the key (/home/username/.ssh/id_rsa): /home/username/.ssh/GitHub_rsa
Enter passphrase (empty for no passphrase):
Enter same passphrase again:
Your identification has been saved in /home/username/.ssh/GitHub_rsa.
Your public key has been saved in /home/username/.ssh/GitHub_rsa.pub.
The key fingerprint is:
SHA256:GcK7ORvFzH6fzA7qPmnzBr1DOWho5cCVgIpLkh6VGb8 Fan@outlook.com
The key's randomart image is:
+---[RSA 2048]----+
| .+... . |
| +o. o |
| o.. oo.. |
|+o. +*.o |
|+.. E.=So . |
|.. o== = |
| .=..+oo |
| +=o+= . |
| .++=.o* |
+----[SHA256]-----+

公钥是一串很长的字符,为了便于肉眼比对和识别,所以有了指纹这东西;指纹位数短,更便于识别且与公钥一一对应。

指纹的用处之一是在使用SSH第一次连接到某主机时,会返回该主机使用的公钥的指纹让你识别。示例:

1
2
3
The authenticity of host 'hostname' can't be established.
RSA key fingerprint is SHA256:nThbg6kXUpJWGl7E1IGOCspRomTxdCARLviKw6E5SY8.
Are you sure you want to continue connecting (yes/no)?

在本机配置多个Github账户

使用以上命令生成两个ssh公钥-密钥对,保存为不同的名称,例如github_user1_rsagithub_user2_rsa。则会生成四个文件如下:

1
2
3
4
-rw-------    1 username  staff   1.8K Oct 28  2019 github_user1_rsa
-rw-r--r-- 1 username staff 407B Oct 28 2019 github_user1_rsa.pub
-rw------- 1 username staff 1.8K Oct 28 2019 github_user2_rsa
-rw-r--r-- 1 username staff 409B Oct 28 2019 github_user2_rsa.pub

配置~/.ssh/config文件如下,如果没有该文件则自行创建一个:

1
2
3
4
5
6
7
8
9
10
11
# github user(your_email_1@example.com)
Host github_user1.github.com
HostName github.com
IdentityFile ~/.ssh/github_user1_rsa
User git

# github user2(your_email_2@example.jp)
Host github_user2.github.com
HostName github.com
IdentityFile ~/.ssh/github_user2_rsa
User git

其中Host字段为HostName的别名,用以区分github_user1github_user2git命令会用repo设置中的Hostname来匹配此处的Host别名,如果匹配成功则访问此处Host对应的HostName

IdentifyFile制定了密钥文件的地址,注意是私钥;

HostName指定了要连接的服务器;

User指定了登录用户名,此处为git

将SSH公钥添加到Github

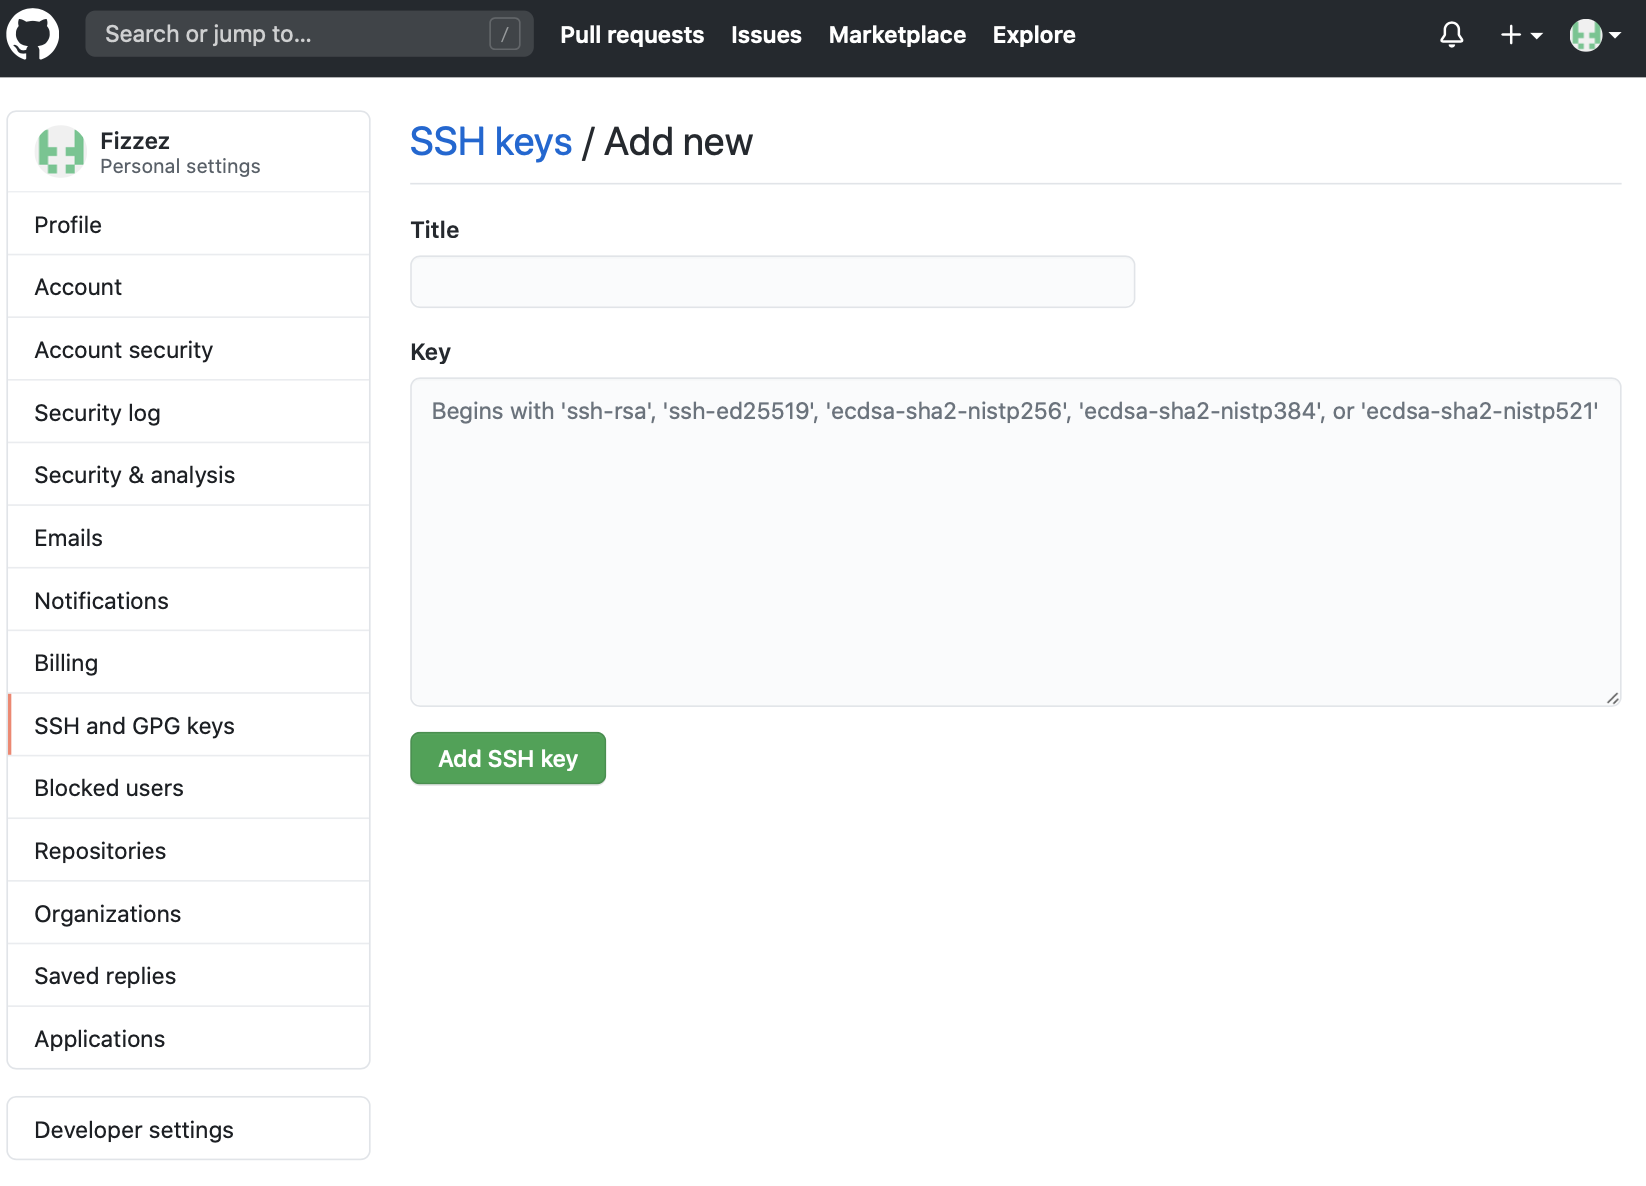
分别在两个Github账户的Settings - SSH and GPG keys页面添加SSH key。如下图所示,Key字段需要复制粘贴对应的github_user1_rsa.pub或者github_user2_rsa.pub公钥文件中的内容。

Add SSH key in Github

测试配置是否成功

使用以下命令测试配置是否成功:

1
2
3
4
5
6
7
8
9
# Address of github_user_1
ssh -T git@github_user_1.github.com
# 出现如下内容,表示使用github_user_1的身份成功链接Github
Hi github_user_1! You've successfully authenticated, but GitHub does not provide shell access.

# Address of github_user_2
ssh -T git@github_user_2.github.com
# 出现如下内容,表示使用github_user_2的身份成功链接Github
Hi github_user_2! You've successfully authenticated, but GitHub does not provide shell access.

配置成功后的使用

git clone为例,使用github_user_1的身份进行操作:

1
git clone git@github_user_1.github.com:fastai/fastai_dev.git

注意此处git@后的host名为~/.ssh/config中,为github_user_1指定的Host

如果对已有repo修改push地址,则需要修改repo根目录下.git/configremote字段内容:

1
2
3
4
5
6
7
8
9
10
11
12
13
14
15
16
17
[core]
repositoryformatversion = 0
filemode = true
bare = false
logallrefupdates = true
ignorecase = true
precomposeunicode = true
[remote "origin"]
# 此处将github.com为Host别名
url = git@github.com:fastai/fastai_dev.git
fetch = +refs/heads/*:refs/remotes/origin/*
[branch "master"]
remote = origin
merge = refs/heads/master
[user]
name = github_user1
email = your_email_1@example.com

因为在上面配置SSH的config文件时,用指定的Host别名替代了原来的Hostname,所以现在应该对不同用户使用不同的Host别名来替代Hostname。

另外,在项目根目录分别设置用户名和邮箱的方法是:

1
2
git config user.name github_user1
git config user.email your_email_1@example.com

参考

  1. Secure Shell - Wikipedia
  2. 图解SSH原理 - TopGun_Viper
  3. SSH key的介绍与在Git中的使用 - faner
  4. ~/.ssh/config文件的使用 - 阳台的晾衣架
  5. Git多用户,不同项目配置不同Git账号 - Lange0x0

Description

Got a pandas DataFrame that has a column with slash-separated properties. I want to conver the properties to column-separated True or False values.

Like the following example. The DataFrame contains 5 persons’ information. The ‘characters’ column, in which slash-sepatared characters are contained, describing the personalities, is the target.

1
2
3
4
5
6
   id gender                characters
0 0 F active/earnest
1 1 M funny
2 2 F active/dedicated/earnest
3 3 F dedicated/disciplined
4 4 M active/disciplined

The result should look like the following. The slash-separated characters are firstly gathered to form the new columns, as a new view to personality, then appended right next to previous DataFrame. If the person has a specific character describe in ‘characters’ column, a True will be given in the corresponding new columns, else False.

1
2
3
4
5
6
   id gender                characters  active  earnest  funny  dedicated  disciplined
0 0 F active/earnest True True False False False
1 1 M funny False False True False False
2 2 F active/dedicated/earnest True True False True False
3 3 F dedicated/disciplined False False False True True
4 4 M active/disciplined True False False False True

Solution

  1. Split the ‘slash-separated properities’ to a list of properties.

    1
    series_characters = df['characters'].str.split('/')
    1
    2
    3
    4
    5
    6
    7
    8
    series_characters

    >>> 0 [active, earnest]
    >>> 1 [funny]
    >>> 2 [active, dedicated, earnest]
    >>> 3 [dedicated, disciplined]
    >>> 4 [active, disciplined]
    >>> Name: characters, dtype: object
  2. Convert the list to pd.Series with default value.

    1
    series_characters = series_characters.apply(lambda lst: pd.Series(dict.fromkeys(lst, True)))
    1
    2
    3
    4
    5
    6
    7
    8
    series_characters

    >>> active earnest funny dedicated disciplined
    >>> 0 True True NaN NaN NaN
    >>> 1 NaN NaN True NaN NaN
    >>> 2 True True NaN True NaN
    >>> 3 NaN NaN NaN True True
    >>> 4 True NaN NaN NaN True
  3. Concat the result to original DataFrame and fill nan.

    1
    df_new = pd.concat([df, series_characters], axis=1).fillna(False)
    1
    2
    3
    4
    5
    6
    7
    8
    df_new

    >>> id gender characters active earnest funny dedicated disciplined
    >>> 0 0 F active/earnest True True False False False
    >>> 1 1 M funny False False True False False
    >>> 2 2 F active/dedicated/earnest True True False True False
    >>> 3 3 F dedicated/disciplined False False False True True
    >>> 4 4 M active/disciplined True False False False True

Notebook Link

A runnable Jupyter Notebook that contains the example above.

https://github.com/Fizzez/playground/blob/master/python/pandas-list-in-cells-to-col-names.ipynb

为了把这篇文章藏起来,他的创建时间被我提早了20年, 从2020年移到了2000年哈哈哈哈。

为什么会有这篇文章

也许是为了稍微记录一下人生中第一次转职时的经验教训,也许只是为了发发牢骚,转换一下心情。

在写下这篇文章的时候,NRI的最终面试已经过去了三天,结果还没有送达。在最终面试之前,一次面试和二次面试都很顺利,聊得很热络。分别都是在面试结束后的第二个工作日送达了面试结果。但是最终面试(人事部采用课)的阶段,我,没表现好。(好的,下面是正文了)

从NRI最终面试想到的

  • 希望来的大,失望就相应的来的也大。

    本身报NRI的时候就没把它当作第一志愿,但是在头两次面试中进行的过于顺利,就开始对进入这家难关公司产生了非常大的希望。

  • 不要放松,不要飘

    在最终面试前,中介告诉我这次面试的通过率大概有80%-90%之高,然后我就产生了一种,最终面试只是谈谈条件,闲聊一番的感觉。其实最终面试也是选考的一关,虽然是人事的对谈,但是面对见多识广的人事面试官,掉以轻心是最要不得的。阅历丰富的人事总是能一眼看透你的想法。。

    然后说回到最终面试通过率的问题。80%-90%意味着什么,不意味着最终面试很简单,而是能闯到最后一关的人基本都具有一定的能力,使你也能通过最终面试。他其实上是你的能力,以及你和公司的匹配度的一个度量。所以最终面试之前就放松自己是绝对要不得的。

  • 面试的时候不要自乱阵脚

    本次面试是和面试官1v1的对谈。一对一本身压力感就很大,更何况对面是50代阅历丰富的老头子。如果被他的这种气势压迫就会让使对方对你产生不好的印象,所以这种时候自己一定要沉住气,有条理的讲,把逻辑讲清楚。本次面试中,这个老爷子还特别不喜欢给我任何的反馈。。不管我怎么讲他都不顺下去问更深入的问题。像是志望动机之类的问题,他也不直接问,而是问你面试过哪些公司,然后你是怎么从中进行选择的。嘛,这人也是很狡猾了。如果你不深入的多像一层的话,可能就会回答的过于浅显,或者没有在答案中延伸到为什么选择你们这家公司(或许这才是他最想要听的)

  • 日语能力要好

    这个是硬伤啊,他上来跟我说把包放在端っこ就好了,我就没听懂这个词。导致后面的面试我都怂怂的。

虽然面试的结果还没有正式出来,但是就看这个情况,大概是凉了。这次这么好的机会被我浪费了。。感觉非常不甘心。郁郁寡欢了好多天哈哈哈哈。但是没办法。能力所限吧还是。之后有机会再继续挑战他。

当然如果是来了内定我也会非常开心的啊啊啊啊啊啊!! 不做过分的期望了,还是要好好准备下面几家的面试。

然后也稍微梳理一下自己欠缺的能力,以及在空闲时间的生活安排

  1. 日语能力(杂谈,交流能力) -> 日常朗读日语会话以及日语单词(晚间60分钟确保)
  2. 日语面试能力(对面试问题的回答,以及反应能力)
    1. 综合日语能力(同上)(面试空档时复习面试问题)
    2. 自我分析,对于不同类型公司的自我分析 -> 需要帮助(12/29解决)
  3. Python代码能力(为了通过Coding Test,在AtCoder练习?)
  4. Machine Learning能力(怎样更好的appeal自己, 主要是Github上还有技术Blog上的,实践一篇论文之类的)
  5. 重新的自我分析,坚决不能透露任何的Negative信息,坚决不能透露自己的优点,坚决要明确的穿达自己的优点。